Contours
This guide shows a few different ways to measure and visualize contours of images.
Using Makie
The most basic way to create a contour plot is simply to use Makie's contour and contourf functions on your image.
Let's see how that works:
using AstroImages, CairoMakie
using Downloads: download

# First load a FITS file of interest
herca = load(download("https://www.chandra.harvard.edu/photo/2014/archives/fits/herca/herca_radio.fits"))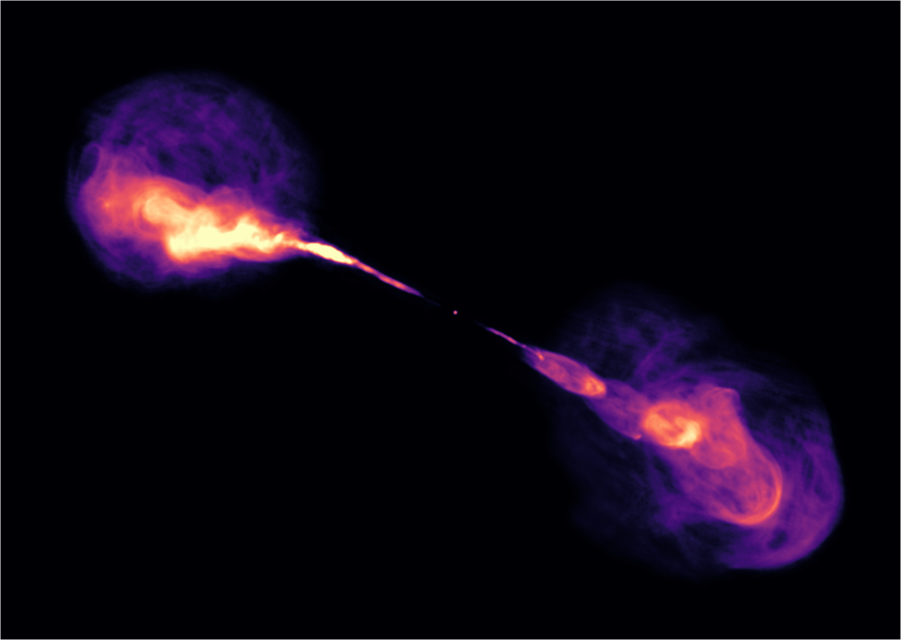
Create a contour plot:
contour(herca)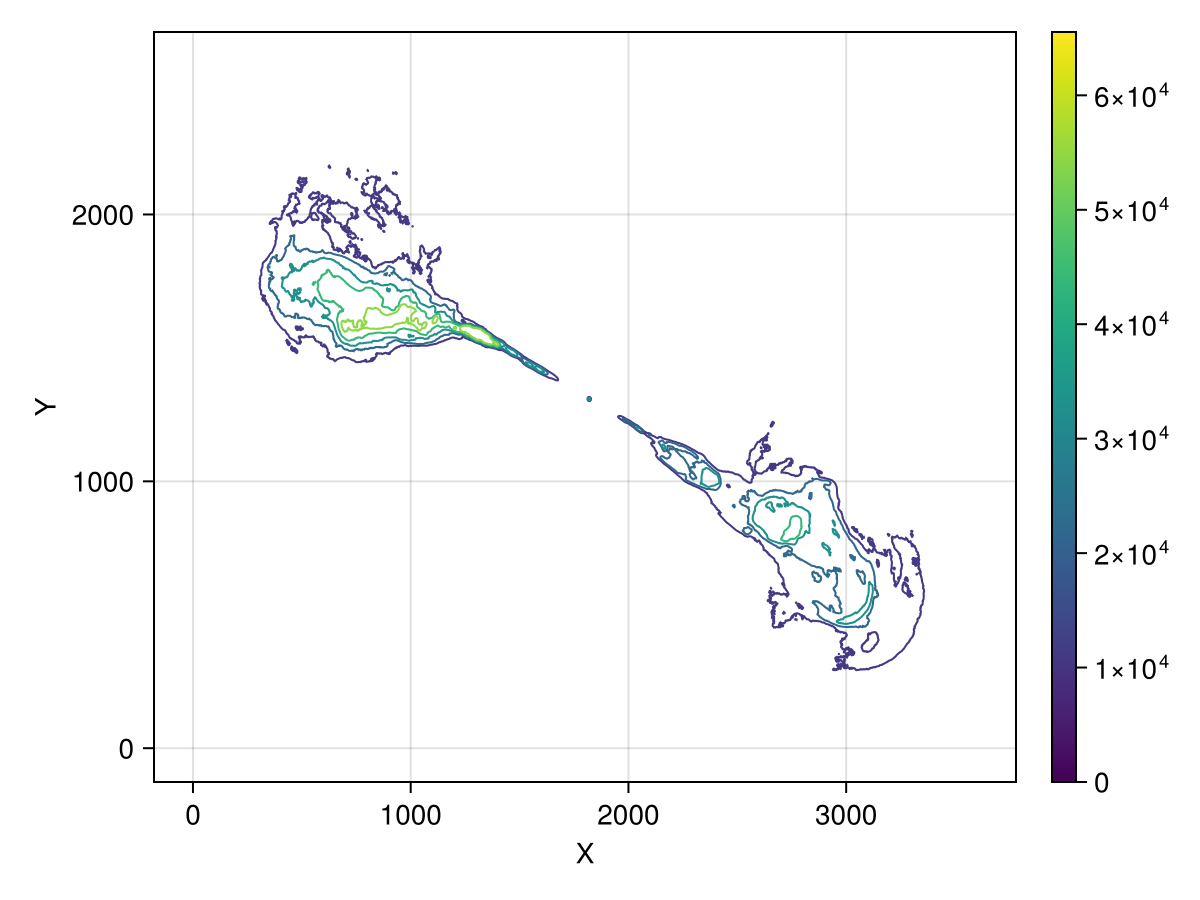
Create a filled contour plot:
contourf(herca)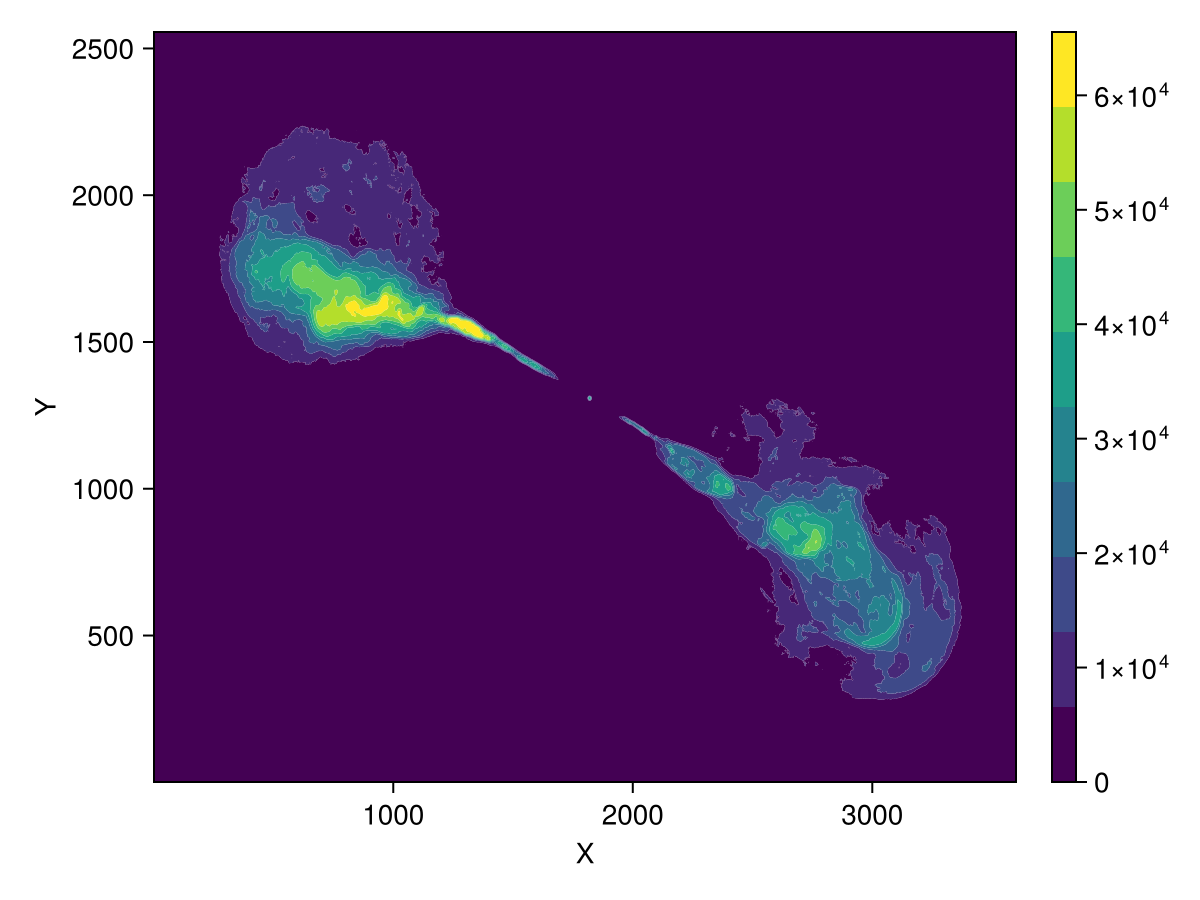
Specify the number of levels:
contour(herca; levels = 5)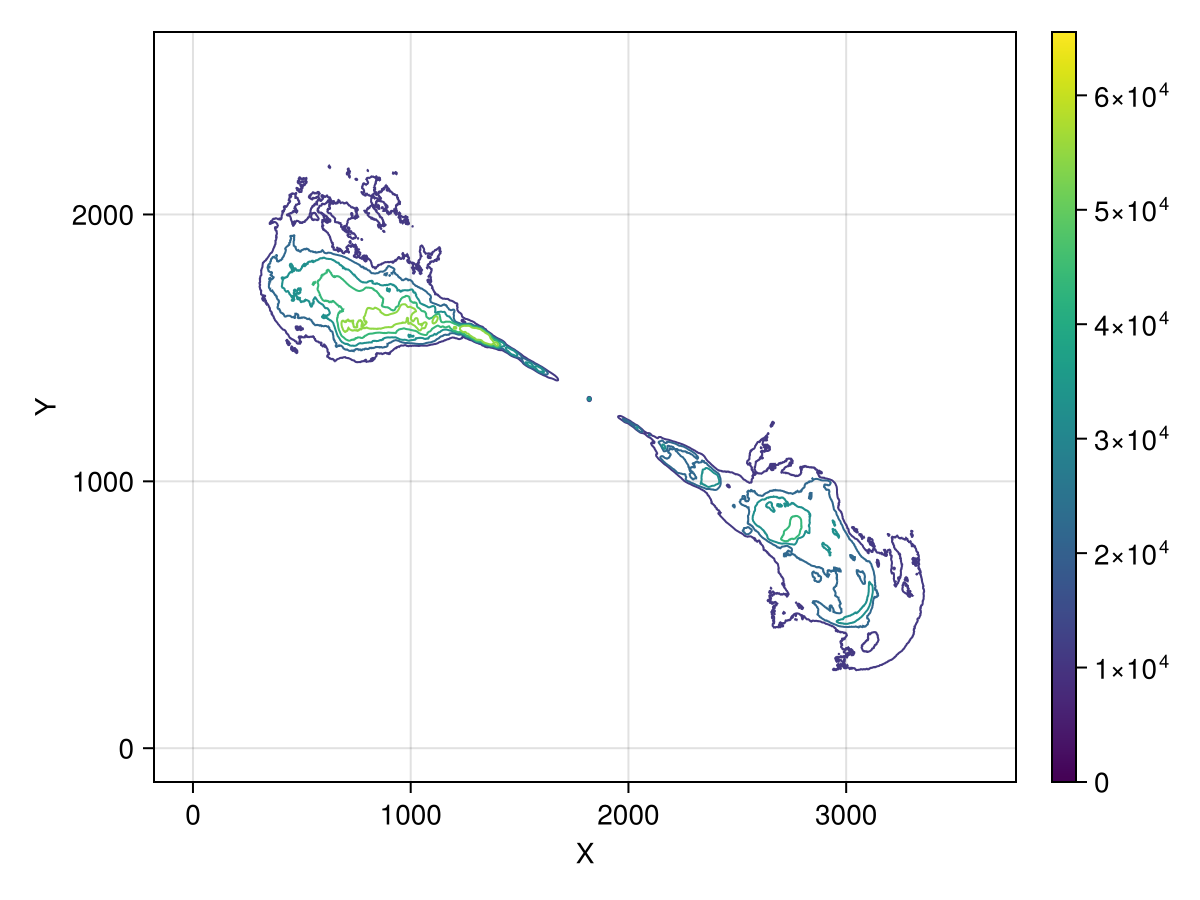
Specify specific levels:
contour(herca; levels = [1, 1000, 5000])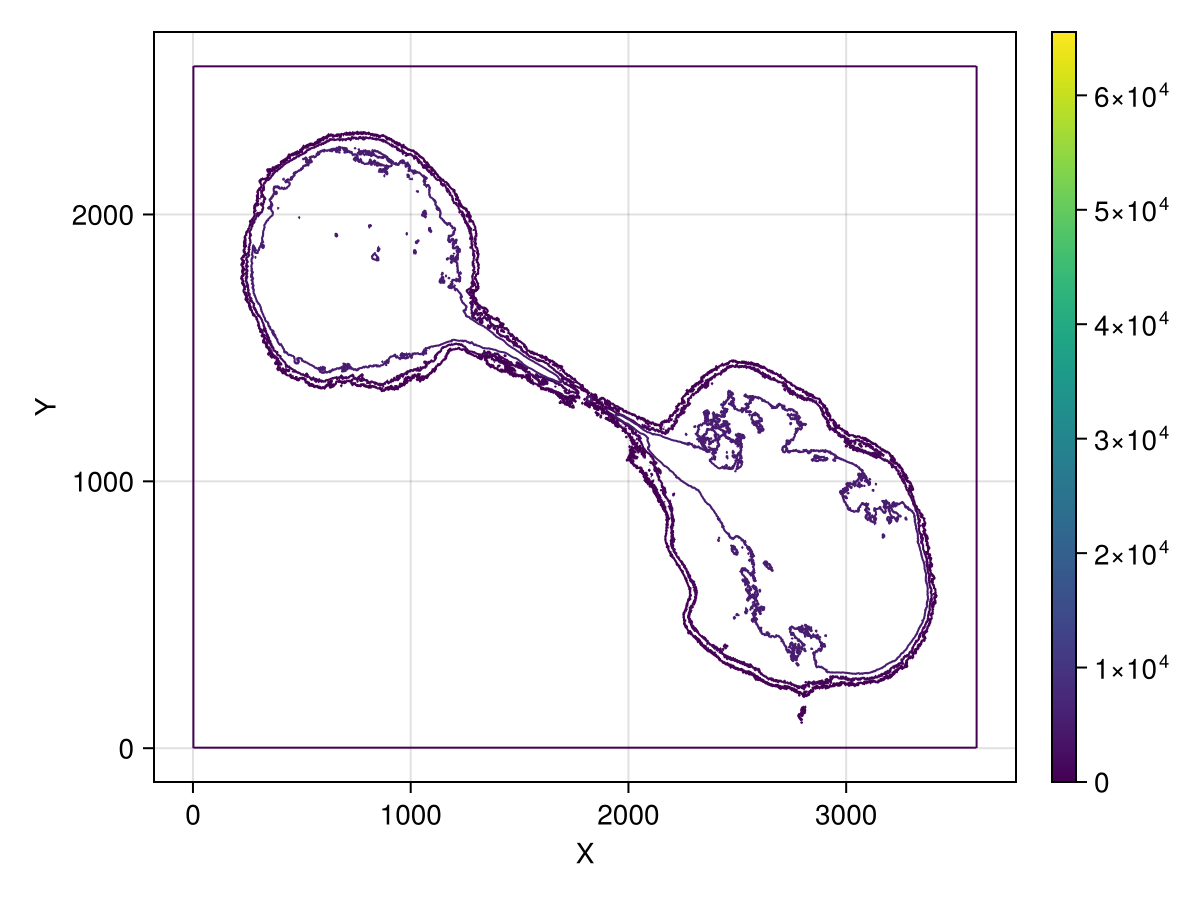
Overplot contours on image:
fig, iv = implotview(herca)
contour!(iv.ax, herca; levels = 4, color = :cyan)
fig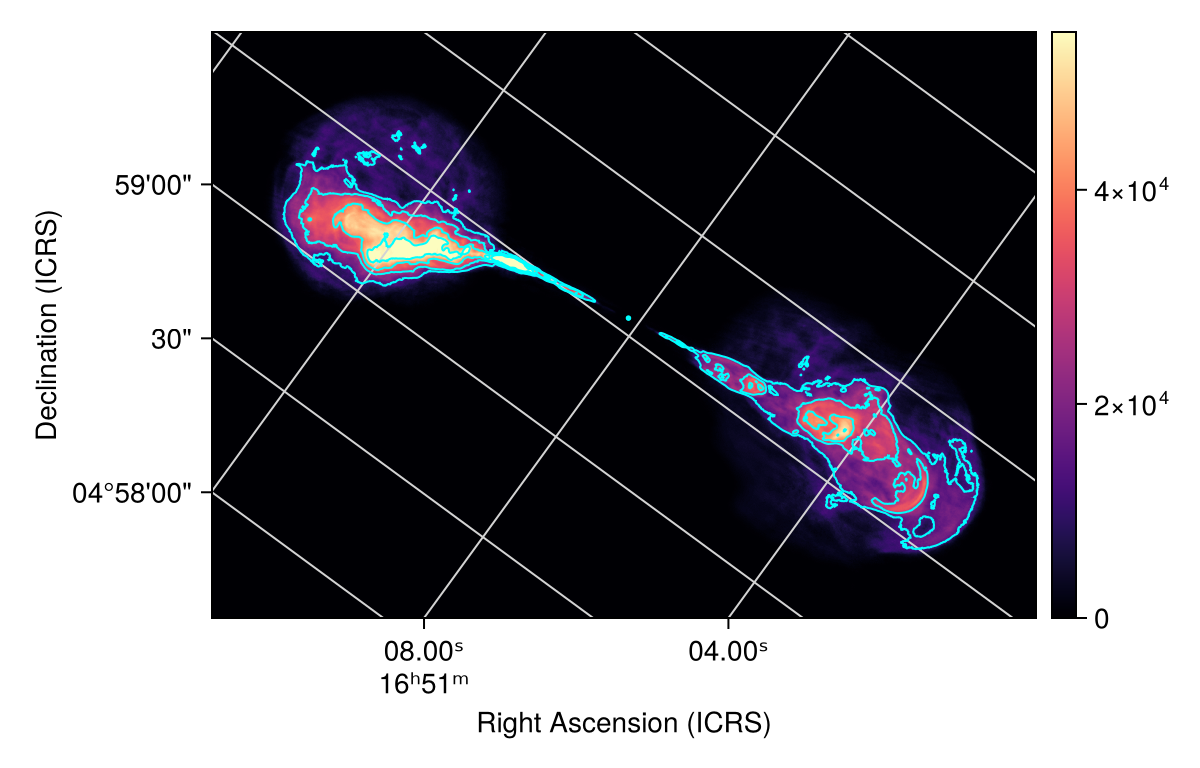
Using Contour.jl
Makie draws contours, but it does not expose the computed contour lines themselves. When we need the contour geometry, for example to transform it into other coordinate systems or to measure it, compute the contours directly with the Contour.jl package. Its marching-squares algorithm is the same one used internally in Makie, so the lines you get match what contour draws exactly. Several of its names (Contour, lines, coordinates) clash with Makie exports, so we import it and qualify its functions:
import Contour

fig, ax, p = implot(herca; cmap = nothing)

cls = Contour.levels(Contour.contours(dims(herca)..., herca))
colormap = :viridis
colorrange = extrema(Contour.level.(cls))

for cl in cls
    lvl = Contour.level(cl) # the z-value of this contour level
    for line in Contour.lines(cl)
        xs, ys = Contour.coordinates(line) # coordinates of this line segment
        lines!(ax, xs, ys; color = lvl, colormap, colorrange)
    end
end

fig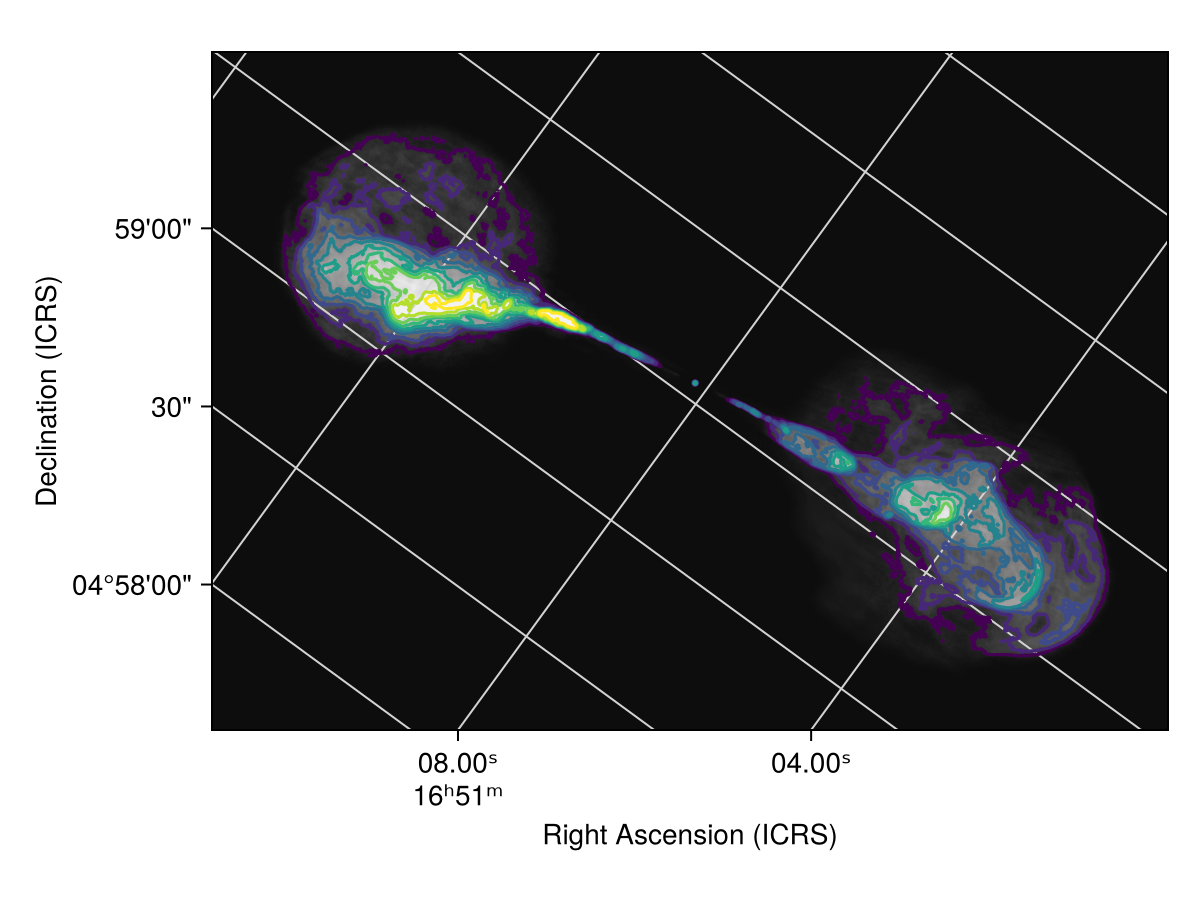
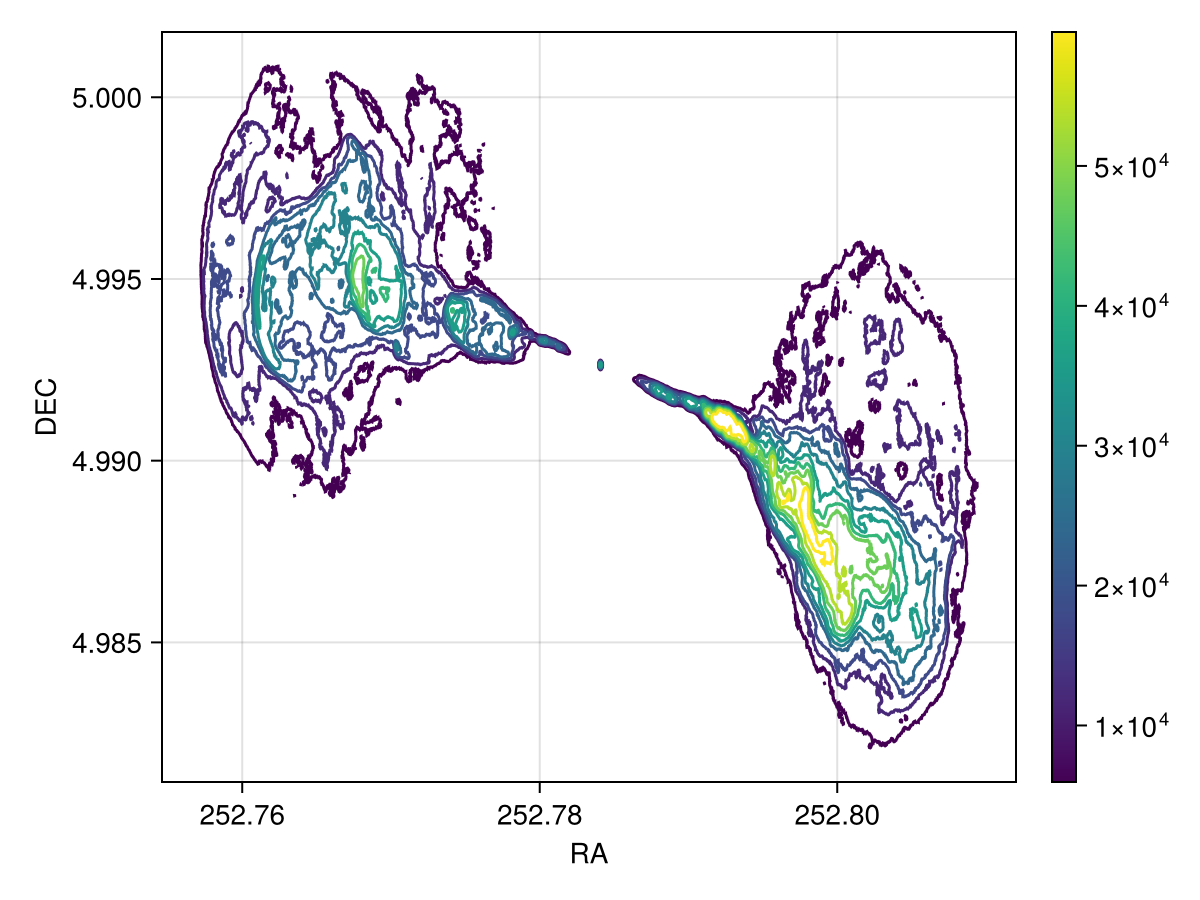
Here we plot just the contours, now in world coordinates:
fig = Figure()
ax = Axis(fig[1, 1]; xlabel = "RA", ylabel = "DEC")

for cl in cls
    lvl = Contour.level(cl) # the z-value of this contour level
    for line in Contour.lines(cl)
        xs, ys = Contour.coordinates(line) # coordinates of this line segment
        worldcoords = map(zip(xs, ys)) do pixcoord
            pixel_to_world(herca, [pixcoord...])
        end
        lines!(
            ax, getindex.(worldcoords, 1), getindex.(worldcoords, 2);
            color = lvl, colormap, colorrange,
        )
    end
end

Colorbar(fig[1, 2]; colormap, colorrange)

fig